Last Thursday (January 6), MBW published a jaw-dropping statistic about the US music market in 2021: 82.1% of music consumption in the second half of the year, we calculated, was of ‘catalog’ music, as opposed to ‘current’ music.
This calculation was solid. We based it on numbers published within US market monitor MRC Data‘s full year 2021 report – which arrived last week – in addition to numbers published in MRC Data’s midyear 2021 report, which was published last summer.
MBW’s math in our analysis was detailed, but the basics are hardly rocket science:
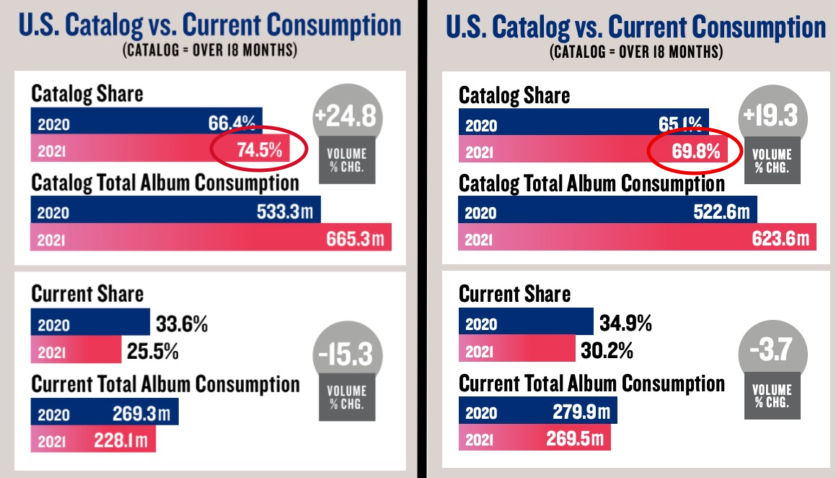
- MRC Data’s H1 2021 report, published last year, showed that catalog claimed 66.4% of US music consumption in the first six months of 2021;
- MRC’s latest report, for the full year of 2021, showed catalog claimed a 74.5% share across the 12 months of 2021;
- Therefore, catalog naturally must have claimed a significantly higher percentage than 74.5% within the last six months of last year (H2 2021).
We crunched the numbers in question for H2 2021 and, lo, 82.1% popped out the other end.
Now, though, we have a problem: Today (January 11) MRC Data has issued a correction to its annual 2021 report, significantly altering its numbers when it comes to both ‘catalog’ and ‘current’ music consumption in 2021.
The headline: Instead of ‘catalog’ music claiming a 74.5% yearly share of US consumption (as originally stated), MRC Data’s newly-corrected report shows that ‘catalog’ actually claimed a 69.8% share of the US music market in 2021.
Stating the obvious, this alteration is significant.
MBW is obviously keen to never mislead our readers, and so below we’ve re-calculated our own analysis of the US market in 2021 using MRC Data’s revised/corrected new numbers.
[You can download the full, newly-revised MRC Data FY 2021 report – with its corrected set of catalog vs. current numbers – through here.]
At the end of this article, you can see MBW’s new charts and calculations based on MRC Data’s corrected 2021 report. Before then, here’s the upshot:
- MBW now calculates that ‘catalog’ music actually claimed a 73.1% share (vs. ‘current’ music) of US consumption in the second half of 2021, as opposed to our previous calculation of 82.1%;
- That 73.1% share, obviously, saw ‘catalog’ music claim nearly three-quarters of the market; ‘current’ music claimed just over a quarter. Statistically, this is a significant acceleration of the share of the market that ‘catalog’ music claimed both in H1 2021 (66.4%), and in the whole of 2020 (65.1%);
- ‘Current’ music is getting less popular in real terms: Across the 12 months of 2021, according to MRC’s new numbers, some 269.5 million ‘Total Album Consumption’ (TAC) units of current music were registered in the US. This was down 3.7% on the 279.9 million figure MRC Data recorded in FY 2020;
- MBW’s calculations suggest that the second half of 2021, ‘current’ music was consumed less in terms of TAC (123.4 million) than it was in the first half of the year (146.1 million).

And now, before MBW’s promised colorful charts, our standard explainer about MRC Data’s ‘Total Album Consumption’ (TAC) unit of measurement, and how it reflects both physical and digital record sales, plus streaming consumption, in the United States:
- MRC’s ‘total album consumption’ (TAC) metric bundles together physical and digital album sales with single-track downloads and (on-demand) streams, with these single-track downloads and streams converted into ‘album equivalent’ units. To achieve this, MRC converts every 1,250 premium streams or 3,750 ad-supported streams of tracks on an album into a single ‘sale’ for that LP. It does the same for every 10 downloads of tracks from a single album. This formula is designed to be ‘revenue reflective’ – for example, with 1,250 premium streams roughly generating the same amount of money as a single album.
And here’s our additional explainer on MRC’s definition of ‘catalog’ versus ‘current’ music:
- ‘Catalog’ music in MRC’s eyes counts as anything released over 18 months before a consumer made a purchase and/or pressed play. ‘Current’ music is in the inverse: any music released within the prior 18 months of the moment a consumer made a purchase and/or pressed play.
Thank you for your patience. On with the charts!


Please note: MBW’s calculations, where credited, are just that – our own conclusions based on MRC Data’s publicly published statistics. We make no claim that MRC Data has endorsed our conclusions.Music Business Worldwide
Stay connected with us on social media platform for instant update click here to join our Twitter, & Facebook
We are now on Telegram. Click here to join our channel (@TechiUpdate) and stay updated with the latest Technology headlines.
For all the latest Education News Click Here
For the latest news and updates, follow us on Google News.