
Jack Wallen has discovered a fantastic Linux performance monitor that is easy to use and gives you all the information you need at a glance. Here’s how to install and use Netdata.

Image: Mark Agnor/ Shutterstock
Every data center admin understands the importance of monitoring servers. Things go wrong, and when they do, administrators need to be on top of things. That’s why every good admin is always on the lookout for a good monitoring tool. And Linux is rife with such things. Toss a stone into a pile of open-source software and you are certain to hit a monitor or twelve. And that’s a good thing, especially considering every one of those monitors approaches the task from a different perspective.
SEE: From start to finish: How to deploy an LDAP server (TechRepublic Premium)
But when you just need the facts, and you need them all wrapped up in a beautiful, easy-to-use web-based interface. Where do you turn? One such possibility is Netdata, which is one of the better at-a-glance performance monitors I’ve used in a long time. This tool can help you track down various performance issues on your Linux servers, by monitoring things like:
- CPU
- Load
- Disk
- RAM
- Swap
- Network
- Processes
- idlejitter
- Interrupts
- Softirqs
- Softnet
- Entropy
- Uptime
- Clock synchronization
- Ipc semaphores
- Ipc shared memory
All of those monitors are cobbled together in a very easy-to-read dashboard that can give you a quick glance at what’s going on with your Linux servers.
Let me show you how to install Netdata.
SEE: Kubernetes: A cheat sheet (free PDF) (TechRepublic)
What you’ll need
To get Netdata installed, you’ll need an instance of Linux and a user with sudo privileges. I’m going to demonstrate on Ubuntu Server 20.04, but the process of installing is the same, regardless of your distribution.
How to install Netdata
First, make sure your server is updated. Log into Ubuntu Server and issue the following two commands:
sudo apt-get update
sudo apt-get upgrade -y
Should your kernel be upgraded, you’ll want to reboot the system before continuing on.
Next, download the Netdata installer script with the command:
wget https://my-netdata.io/kickstart.sh
When the download finishes, run the installer with the command:
sudo sh kickstart.sh
You will be asked to OK the installation a couple of times, so pay attention to the output of the command. Once you give the final OK, the installation will commence, and you can walk away from the server (as the installation will take a few minutes). When the installation completes, the Netdata services will be automatically started and enabled. But in case they aren’t, you can start and enable Netdata with the commands:
sudo systemctl start netdata
sudo systemctl enable netdata
How to access the Netdata UI
Open a web browser on a machine that’s connected to the same network as your data center and point it to http://SERVER:19999. You should be greeted by the Netdata dashboard (Figure A).
Figure A
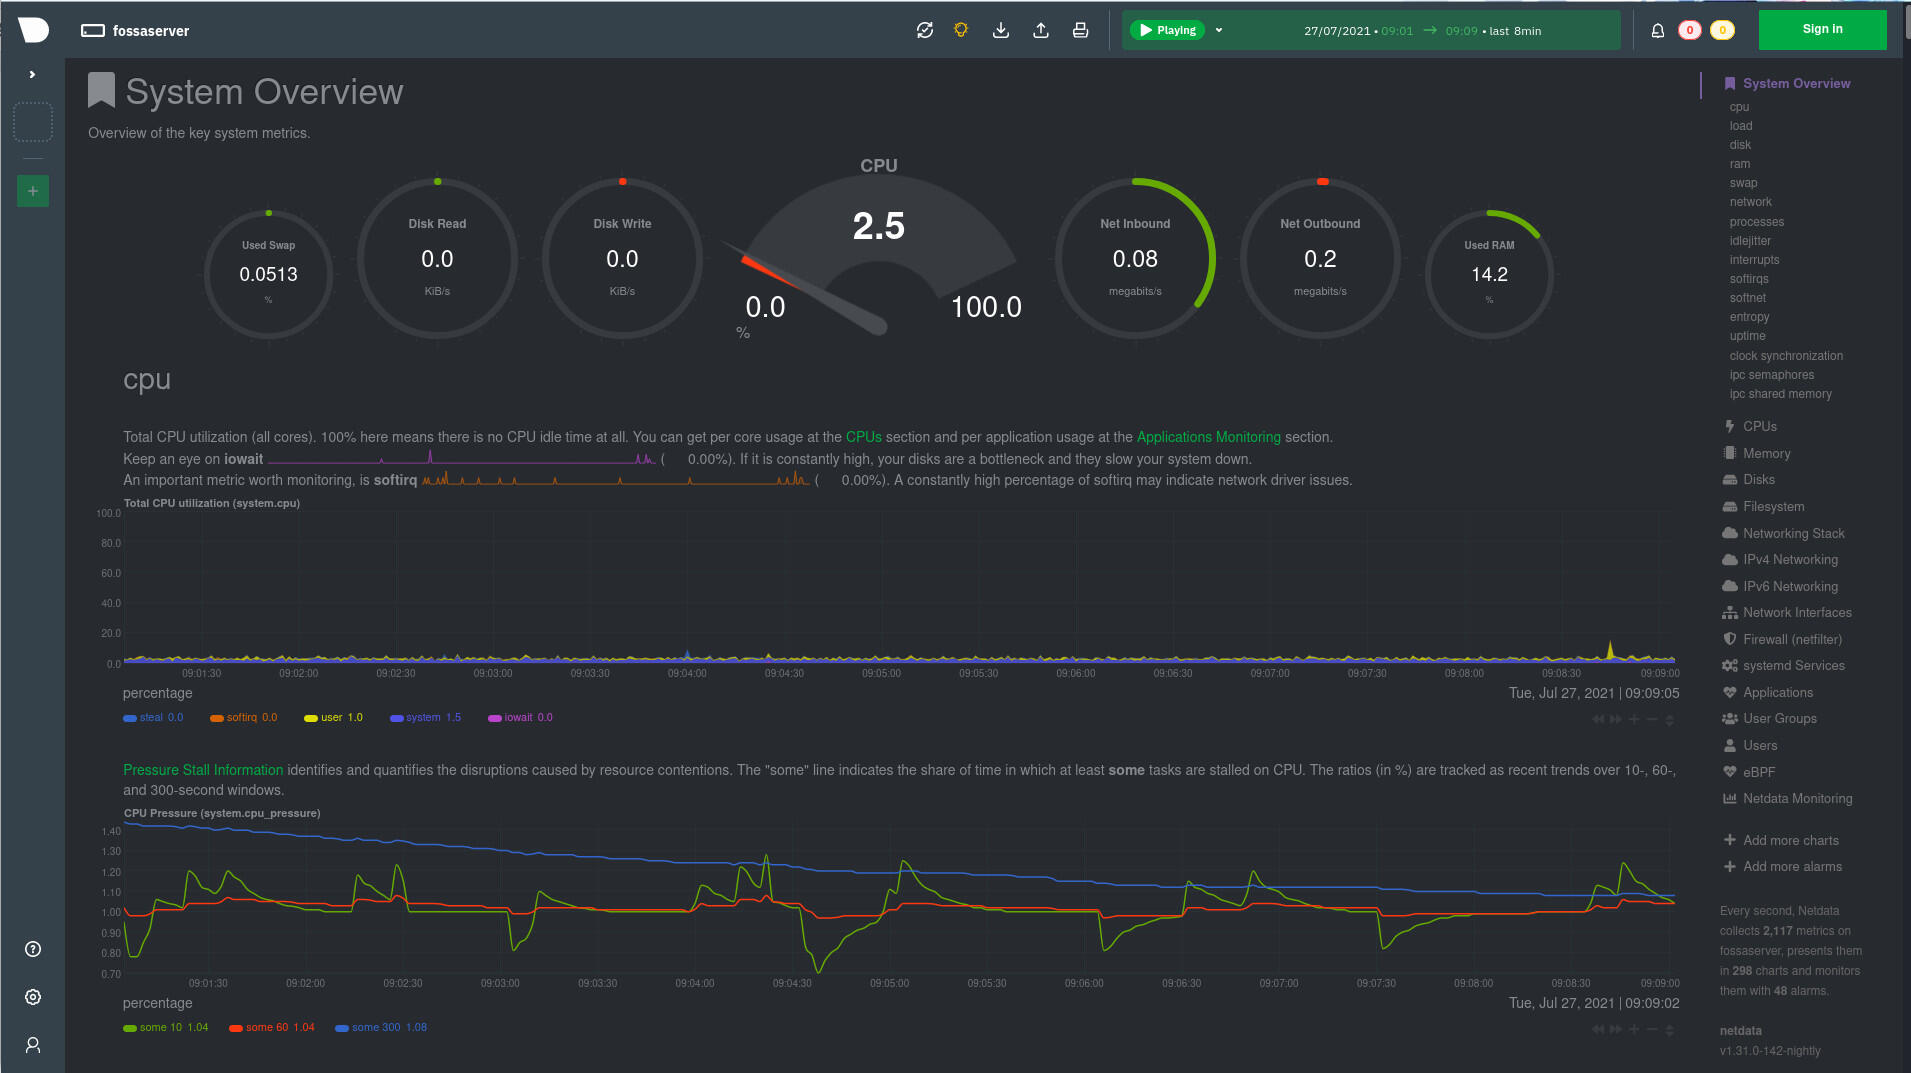
The Netdata dashboard is simple to read and well designed.
If you click the Sign In button, you’ll be directed to create a Netdata account, where you can then monitor all of your servers, from one handy, cloud-based interface. If you go this route, you’ll be given a command to run on the server hosting Netdata, in the form of:
sudo netdata-claim.sh -token=TOKEN -rooms=ROOMS -url=https://app.netdata.cloud
Where TOKEN is the individual token and ROOMS is the name of the room you created when you signed up.
Once you claim your server, you’ll be able to view the Netdata dashboard from within your Netdata account (so you can access the server dashboard from outside your LAN).
If you don’t want to go that route, simply don’t click the Sign In button and monitor each of your servers individually.
And that’s all there is to installing the Netdata Linux server monitoring tool. Give this open-source dashboard a try and see if it doesn’t become your go-to performance monitor for Linux.
Subscribe to TechRepublic’s How To Make Tech Work on YouTube for all the latest tech advice for business pros from Jack Wallen.

Data Center Trends Newsletter
DevOps, virtualization, the hybrid cloud, storage, and operational efficiency are just some of the data center topics we’ll highlight.
Delivered Mondays and Wednesdays
Also see
Stay connected with us on social media platform for instant update click here to join our Twitter, & Facebook
We are now on Telegram. Click here to join our channel (@TechiUpdate) and stay updated with the latest Technology headlines.
For all the latest Technology News Click Here
For the latest news and updates, follow us on Google News.