Personal finance company Sofi Technologies (NASDAQ: SOFI) stock has been punished with the benchmark index sell-off despite seeing strong growth in its various segments. The popular provider of loans ranging from student, personal and home saw record growth in 2021 as it grew its customer base to 3.5 million users, up over 80%. The Company will benefit from the projected seven interest rate hikes in 2022 to combat raging inflation. Further tailwinds from its bank charter should materialize for its top and bottom lines. Sofi is acquiring cloud core banking platform Technisys to help vertically integrate its business segments and accelerate growth opportunities. Prudent investors seeking a bargain entry into a rising fintech player can watch for opportunistic pullbacks in shares of Sofi Technologies.
Depositphotos.com contributor/Depositphotos.com – MarketBeat
Q4 Fiscal 2021 Earnings Release
On March 1, 2022, Sofi released its fiscal fourth-quarter 2021 results for the quarter ending December 2021. The Company reported diluted adjust earnings-per-share (EPS) loss of (-$0.15) missing consensus analyst estimates for a loss of (-$0.12) by (-$0.03). Total revenues rose 53.8% YoY to $279.88 million versus $2279.47 million consensus analyst estimates. The Company hit a record 523,000 quarterly new members, up 39% sequentially and 906,000 quarterly new product adds up 51% sequentially. Sofi CEO Anthony Noto commented, “We hit new highs across our key financial and operating metrics in the fourth quarter, finishing 2021 with record annual results. Adjusted net revenue of $280 million was another quarterly record for us, up 54% year-over-year and up sequentially, even with the unexpected extension of the federal student loan payment moratorium in late December. We exceeded $1 billion in annual adjusted net revenue for the first time. We also delivered fourth quarter adjusted EBITDA of $5 million — our sixth consecutive positive quarter — resulting in positive full-year adjusted EBITDA of $30 million. The best part is that we were able to reach both our adjusted revenue and adjusted EBITDA milestones ahead of plan in an increasingly challenging operating environment, while also significantly exceeding our member growth guidance.”
Mixed Revenue Guidance
Sofi issued downside earnings guidance for fiscal Q1 2022 with revenues expected between $280 million to $285 million versus $303.56 analyst estimates. The Company raised its fiscal full-year 2022 guidance for revenues coming in at $1.57 billion versus $1.45 billion consensus analyst estimates
Conference Call Takeaways
CEO Noto continued to hammer in the point of Sofi hitting new highs across key financial metrics including 54% YoY top line growth. Growth continued in all three of its business segments generating over $1 billion in total annual sales for 2021 and sixth consecutive quarter of adjust EBITDA. Sofi ended 2021 with 3.5 million total members, up 87% YoY. Its Galileo subsidiary grew account by 67% to 100 million. Personal loan originations grew 168% YoY in Q4 2021 credited to enhancements to its technology, quality of loans, and credit models. The Company grew purchased home loans from low single-digits to low-double digits in relation to total home loan value percentages. Sofi relaunched jumbo loans in the second half of 2021 helping to drive growth despite rising rates. Student loans grew 50% sequentially originating over $1.5 billion ahead of the January federal student loan moratorium deadline. The Company expects continued acceleration to loans growth driven by opportunities bestowed upon it from the new bank license it acquired in 2021. The Company added 2.5 million new financial services products in 2021 and launched services like SoFi Money, SoFi Checking and Savings offering members 1% APR and the SoFi Credit Card, which gives rewards for both purchases and smart financial behaviors.
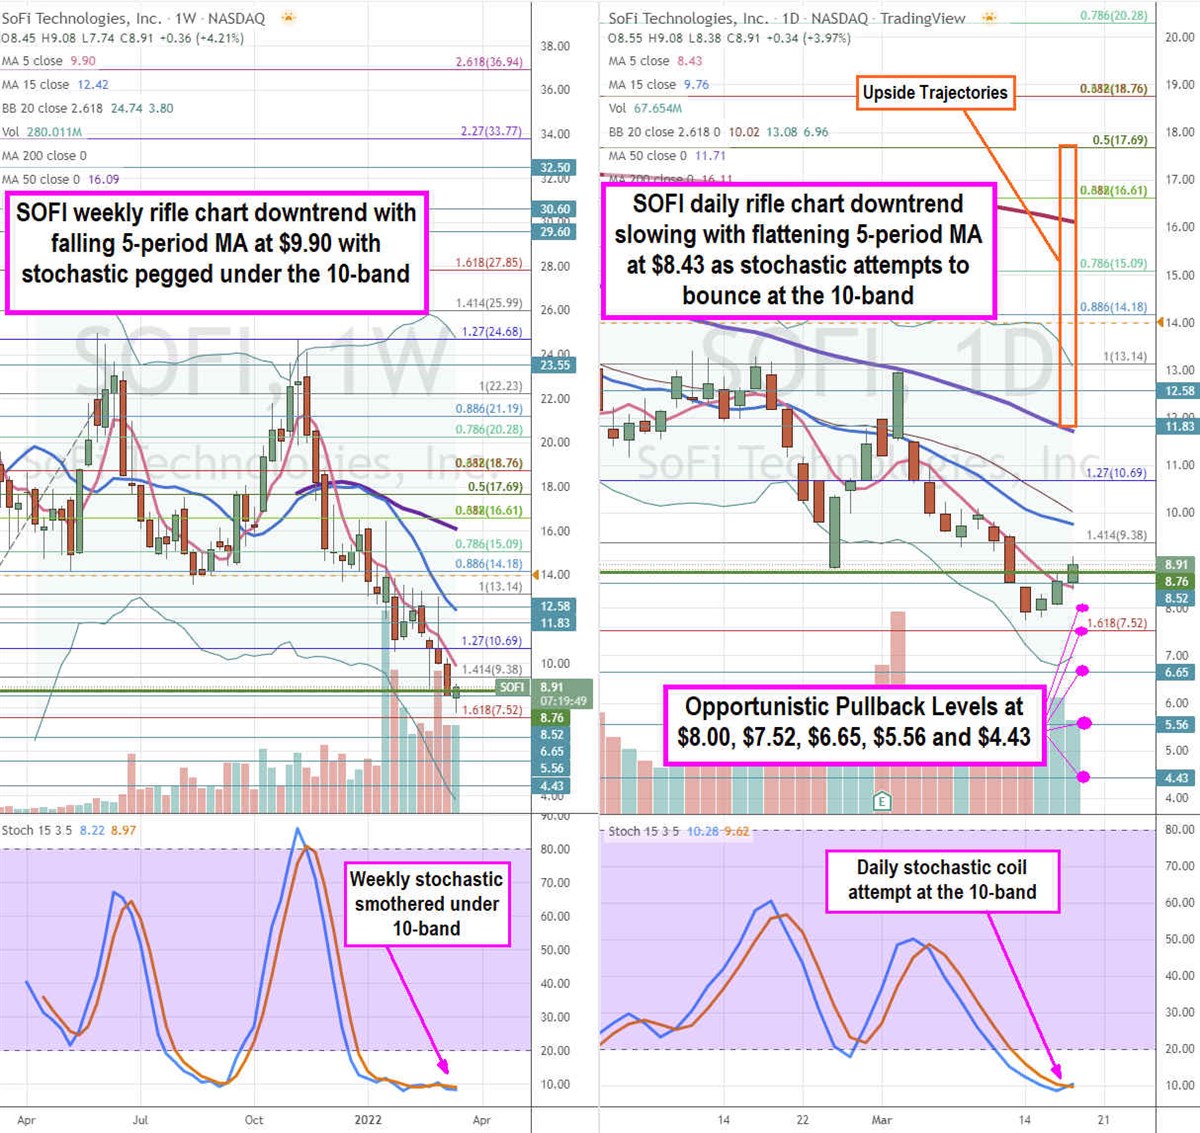
SOFI Opportunistic Pullback Levels
Using the rifle charts on the weekly and daily time frames provide a precise view of the price action playing field for SOFI stock. The weekly rifle chart peaked off the $24.68 Fibonacci (fib) level before collapsing towards the $7.52 fib afterwards. The weekly rifle chart has a downtrend with a falling 5-period moving average (MA) at $9.90 followed by the 15-period MA at $12.42. The stochastic is compressed under the 10-band indicating very oversold conditions. The weekly lower Bollinger Bands (BBs) sit at $3.80. The weekly 50-period MA sit at $16.09. The daily rifle chart downtrend is starting to slow down as the market structure low (MSL) buy triggers above $8.76. The daily 5-period MA is flattening at $8.43 while 15-period MA closes the channel at $13.08. The daily stochastic is attempting to cross up at the 10-band. The daily lower BBs are coiling up at $6.96. Prudent investors can watch for opportunistic pullbacks at the $8.00 level, $7.52 fib level, $6.66 level, $5.56 level, and the $4.43 price level. Upside trajectories range from the $11.83 level up towards the $17.69 fib level.
Stay connected with us on social media platform for instant update click here to join our Twitter, & Facebook
We are now on Telegram. Click here to join our channel (@TechiUpdate) and stay updated with the latest Technology headlines.
For all the latest Education News Click Here
For the latest news and updates, follow us on Google News.